.png)
High-Resolution Asset Location Data: A New Frontier in Geospatial Risk Analysis for Finance

Summary
Financial institutions are increasingly recognising that where company assets are located is as critical as what products and services the company delivers. From climate change and natural catastrophes to supply chain disruptions and geopolitical conflicts, many risk drivers are inherently spatial. Traditional risk data – often aggregated at the firm or sector level – can obscure local vulnerabilities. In contrast, high-resolution asset location data, namely granular information on the precise coordinates of physical operations is emerging as a cornerstone of risk management. Regulators and frameworks worldwide now emphasise the importance of geographic specificity.
For example, the Task Force on Climate-related Financial Disclosures (TCFD) advises firms to assess physical climate risks in their operations, which inherently demands location-specific analysis. Likewise, the European Central Bank (ECB)’s climate stress testing guidelines and Network for Greening the Financial System (NGFS) climate scenarios require banks to map exposures to region-specific hazards. This extends to the Taskforce for Nature Related Financial Disclosures (TNFD), where location specificity is the first step in any ‘LEAP’ assessment of material risk. Accurate, validated asset location data thus enables a clearer understanding of multiple financial risks – climate risk (physical and transition), nature risk, credit and counterparty risk, operational and supply chain disruptions, and even geopolitical exposures – and supports better decision-making.
This white paper explores how integrating high-resolution geospatial data transforms risk analysis across these domains, drawing on industry best practices and frameworks to illustrate the value of literally putting assets on the map - and how the latest advances in technology are delivering higher resolution validated data with more precision than ever before.
From aggregation to assets: Why location matters
Traditional environmental, social, and governance (ESG) data and risk metrics are often reported at the company or regional level, averaging out the nuances of individual sites. This can lead to blind spots. As the UK Centre for Greening Finance & Investment (CGFI) notes, a company’s environmental impacts and dependencies are “inherently location and context specific. Location data of counterparties’ operations is therefore critical for financial institutions to understand … financial risks in a meaningful way.” In short, without asset-level location intelligence, risk analyses may “miss the forest for the trees”.
Firm-wide averages dilute local extremes and priority locations. An oil & gas company, for instance, might disclose a general climate risk rating or an aggregate biodiversity impact, but that fails to distinguish a refinery built in a coastal hurricane zone from one located inland. Similarly, a mining firm’s overall land footprint tells us little about where that land is – a mine in a fragile tropical ecosystem versus one in a barren desert carry very different risk profiles. Studies have highlighted persistent gaps in conventional ESG assessments due to this lack of granularity. Inconsistencies across data providers – the well-known “ESG ratings divergence” problem – often stem from using different sources and assumptions, many of which gloss over site-specific context. The result is that critical hotspots of risk can be hidden within averages.
Emerging research shows that incorporating high-resolution spatial information can dramatically improve risk analysis. By knowing exactly where operations occur, analysts can marry asset-level exposure with local environmental conditions. Rossi et al. (2023) argue that geospatial data offers “enhanced accuracy” and the ability to identify risks at a detailed physical asset level, as well as consider the broader spatial context. This means analysts can overlay asset locations onto maps of flood plains, wildfire-prone areas, water stress indices, or socioeconomic data, to generate an asset specific risk profile. Such a granular approach contrasts with generic company-level metrics that often overlook site-level hotspots.
Crucially, spatial context reveals hidden risks that would be invisible in aggregate data. In nature risk analysis, this is framed as “double materiality” – how nature impacts the company and how the company impacts nature – and both sides are highly location-dependent. For example, a large agribusiness or datacentre might appear low-risk in a broad ESG scorecard, until geospatial analysis shows its plantations or operations overlap with endangered species habitat and water-scarce basins. In the climate arena, a manufacturing firm might seem resilient overall, but a single critical factory situated in a flood-prone delta could pose a severe vulnerability if mapped properly. These insights – pinpointing which assets sit in harm’s way (whether environmental sensitivity or physical hazard) – are rarely attainable through coarse data or voluntary corporate reporting alone.
Illustrative example: Enhancing risk mapping through asset-level filtering
To illustrate the utility of high-resolution location data, consider the case of a large, global energy company with thousands of physical assets spread across regions—from offshore infrastructure and industrial facilities to urban retail locations.
A traditional risk analysis might evaluate the firm based on aggregate environmental metrics, such as total emissions or company-wide biodiversity policies. However, a granular, geospatial approach inventories each facility and evaluates its specific environmental context. When all sites are considered equally—including a high number of low-impact urban retail locations—the average nature risk appears minimal.
But when data is filtered to include only a subset of core operational assets (such as major processing plants or extraction sites), a very different picture emerges. For instance, biodiversity exposure categories of risk (risks due to locations adjacent to key areas of biodiversity, and subsequent loss of ecosystem intactness or integrity) scores may increase sharply due to overlaps with rare species habitats, with a possible subsequent increase in water scarcity, while water pollution risk metrics may decrease as diffuse urban sites are excluded. This highlights how the inclusion of non-material sites can dilute or distort true risk profile.
This example reinforces a critical best practice: quality over quantity. Intelligent filtering of location data sharpens the signal by focusing on what is material. It reveals site-specific exposure to environmental risks that might otherwise be hidden in firm-level averages.
This principle applies broadly—whether for nature, climate, credit, or operational risk—and demonstrates how targeted use of high-quality location data can reshape both risk assessment and strategic action. In summary, moving from aggregate to asset-level analysis transforms risk identification. Granular location intelligence exposes the heterogeneous nature of risk – one that varies from site to site – enabling risk managers to see concentrations and outliers that would otherwise remain buried in averages. Next, we explore how this capability enhances the management of specific financial risk types.
The nature delta
What does adding additional dimensions of natural world risk deliver over and above a purely climate-based risk lens? In research being undertaken by NatureAlpha, analysis on quantifying specific variables of nature-related impact and dependency in relation to value at risk (VaR) is being undertaken. This Nature Delta represents the change in financial risk assessment or asset value that occurs when high-resolution, location-specific nature risks—such as biodiversity loss, ecosystem degradation, water stress, or protected area encroachment—are integrated into traditional climate risk models that previously ignored or aggregated these factors. The approach is analogous to that of catastrophe models in understanding the delta in expected loss, capital reserves, or pricing, for example:
• Biodiversity Risk – Physical Operations
A datacentre located near a protected area may face future operating constraints due to legal or community action, or through lack of declining water availability essential for cooling. When mapped precisely, it is revealed that the site overlaps with a high-risk zone for endemic species and water stress. The nature delta here is the increase in probability-weighted future cost (e.g., from permitting delays, conservation obligations, or the cost of water cooling).
• Water Risk – Operational Continuity
An agribusiness facility operating in a key water-scarce river basin may face downtime or rising input costs during drought years. Traditional models would assign the same risk profile as similar facilities in water-rich regions. The nature delta is the adjusted expected loss from climate-amplified water competition, now visible through spatial water risk layers.
• Reputation & Regulatory Risk – Transition Risk Parallel
A mining company with projects near indigenous lands and high ecosystem intactness may face divestment pressure or tougher financing terms. The nature delta is seen in a higher cost of capital once investors use location data to quantify the potential reputational and legal liabilities.
Quantifying the delta
A nature-adjusted model can produce at an asset or portfolio level:
• Nature-adjusted VaR – loss at confidence interval X that includes disruption or cost from ecosystem-related shocks
• Nature-adjusted Expected Loss (nEL) – expected operational or regulatory loss adjusted for spatial nature risk
• Nature Risk Exposure Index (NREI) – a composite scoring of asset-level exposure to multiple nature drivers (e.g., akin to a CAT risk score)
Limitations are present. Policies and regulations vary by jurisdiction, market conditions vary by geography, and social pressures differ by community; differentiation at scale is therefore a challenge.
Dimensions like operating volumes and revenue streams of assets present a similar challenge, though can be tackled at an asset level. Beginning with an analysis of TNFD priority locations screened for a company in this regard may represent a valid starting point for company-level analysis, which may then be extrapolated to aggregate portfolio levels.
Enhancing risk analysis across key domains
High-resolution asset location data enriches the understanding of a wide spectrum of financial risks. Below we discuss its value for climate risks (both physical and transition), credit risk, operational/supply-chain risk, and geopolitical risk, with use cases for each.
Physical climate risk
Location precision is paramount for physical climate risk assessment. Climate hazards like floods, hurricanes, wildfires, heatwaves, and sea-level rise are unevenly distributed across geographies. Even within a single country, one region may face frequent flooding while another suffers drought. Thus, a bank or insurer can only gauge its true exposure to climate extremes by mapping which assets lie in harm’s way, and understanding the impact of a halt in productivity of that asset in relation to revenue generation. High-resolution geolocation data allows financial institutions to overlay assets onto hazard maps and climate model projections with greater accuracy than using proxies such as assumptions based on company headquarters or within incorporation countries.
In practice, integrating asset coordinates with climate data yields more accurate loss projections and resilience plans. For example, a lender can take the GPS coordinates of factories in its loan book and determine how many are within 100-year floodplains or coastal storm surge zones under various scenarios. If a future climate scenario projects a doubling of extreme rainfall events in a region, the bank has the potential to directly identify which loans back facilities likely to be inundated. This granular approach was echoed in regulators’ exercises, for example the ECB’s 2022 climate stress tests – and it is worth noting that analogous nature scenario planning is under the lens of consideration now informed by the CFRF (2024, 2025). Many banks found that without precise location data, they had to rely on rough estimations of physical risk. Supervisors themselves recognise this limitation. They note that to conduct robust climate stress tests or “hotspot” analyses, they “need to know where banks’ and insurers’ exposures lie relative to [hazards]”, whether those are flood zones, wildfire-prone forests, or – in the case of biodiversity – vulnerable ecosystems. In one analysis, mapping loan exposures to specific locations revealed that a large share of one country’s banking assets were tied to operations in a single high-risk region – a concentration risk that would have been obscured without geospatial mapping.
Financial firms are now borrowing tools long used by the insurance industry. Insurers have traditionally priced property coverage by evaluating location-specific catastrophe models (for example, using a building’s coordinates to estimate hurricane wind damage risk). Banks and asset managers are starting to do the same for climate risk: linking each asset or collateral to local climate hazard data (from sources like WRI Aqueduct for water risk or downscaled IPCC climate models for future projections). This allows for a bottom-up aggregation of risk. Rather than assigning every asset in, “Southeast Asia” the same climate risk score, granular data might show that within Southeast Asia, one facility sits on high ground with a flood defence levee (low risk) while another is along an unprotected riverbank (high risk). Such differentiation is only possible with precise geospatial intelligence.
Incorporating this intelligence yields practical benefits: risk mitigation and adaptation efforts can be targeted to the most endangered sites. A bank that knows exactly which factories in its portfolio are in high flood-risk zones can engage those clients to improve flood defences or can adjust lending terms (e.g. shorter maturities, higher interest rates) to reflect the added risk. Moreover, disclosures aligned with TCFD and emerging climate accounting standards (like IFRS S2) increasingly call for reporting the location of assets subject to material climate risk. High-resolution data makes it straightforward to report, for example, “5% of our portfolio by value is located in Tier 4 (severe) flood hazard zones,” in line with such disclosure expectations. In sum, precise asset location data is the linchpin for understanding physical climate risk – it turns abstract projections of climate change into concrete insights about which investments are exposed. As one report put it, having the exact “coordinates of risk” enables financial decision-makers to align their portfolios with the reality of climate hazards on the ground.
Climate: Transition Risk
While physical risks relate to acute climate events, transition risks stem from the world’s response to climate change – policy shifts, technological changes, market evolution, and reputational pressures as we transition to a low-carbon economy. Transition risk can also be highly location-dependent, and asset location data provides an edge in analysing these exposures.
One major driver of transition risk is policy and regulation, which often varies by jurisdiction. Carbon pricing, emissions trading systems, and environmental regulations are applied at national or subnational levels. If a company operates a carbon-intensive plant in a country with stringent climate policies (or a stated net-zero by 2050 commitment), that asset faces higher regulatory costs and potential stranding, compared to a similar asset in a country with weaker or delayed climate policies. For instance, a coal-fired power station in Western Europe (subject to the EU Emissions Trading Scheme and impending phase-out deadlines) has a radically different outlook than a coal plant in Southeast Asia. Only by pin-pointing asset locations can investors and banks quantify how much of a company’s business is in high-regulatory-risk regions versus low-regulatory-risk ones. Granular location data thus feeds into policy scenario modeling: using frameworks like NGFS climate scenarios, an institution can overlay its assets on regions defined as “Net Zero 2050” (fast transition) vs “Current Policies” pathways and estimate differential impacts.
Local market conditions and technology adoption also vary by geography. Consider the automotive sector: an auto manufacturer with plants in a country rapidly scaling up electric vehicle adoption (and planning bans on internal combustion engines) will need to transition faster than one in a country with less EV infrastructure. Asset location intelligence might reveal, for example, that a significant portion of a supplier’s factories are in states with aggressive clean energy mandates – flagging a need for that supplier to invest in new technology or face competitive disadvantage. Similarly, the carbon intensity of electricity grids differs by location; a factory in a region powered predominantly by coal will have higher indirect (Scope 2) emissions than one in a region with renewable energy, affecting its transition risk profile. Knowing the exact locations allows financiers to plug in region-specific grid emission factors and project future changes as energy systems decarbonize.
There is also a social and permitting dimension to transition risk where location matters. Local opposition or community attitudes can determine whether projects get approved. We see this clearly at the intersection of climate and nature: an oil or mining project in an ecologically sensitive or culturally significant location might face permit denials, legal challenges, or protests that effectively strand the asset – even if, on paper, national policy still allows it. Investors increasingly talk about “stranded asset” risk beyond climate alone, encompassing nature and community factors. For example, a proposal for a new coal mine or a palm oil plantation could be cancelled or delayed if located near a protected forest or on indigenous land, due to public and stakeholder pressures. Granular data helps identify such vulnerable projects ahead of time. As one use-case noted, having precise location data allows investors to foresee if a new asset sits in an area likely to trigger backlash or stricter future regulation, and therefore incorporate that risk into valuations.
In summary, transition risk analysis benefits from asset-level location information by linking each asset to the regulatory regime, market context, and social environment it operates in. This enables more nuanced scenario analysis – for instance, “what if carbon price X is imposed in region Y where these assets reside?” – and helps institutions ensure their portfolios are aligned with climate transition pathways. It also helps identify outlier assets that may become stranded due to location-specific factors, guiding strategic decisions (e.g. divestment, early closure, or technology retrofit plans for those facilities). In the emerging nature risk sphere, the cost of higher environmental regulations or stranded assets resulting from stricter governance or the expansion of protected areas can be assessed.
Credit and counterparty risk
Credit risk – the risk of loss due to a borrower’s or counterparty’s default – is fundamentally tied to the borrower’s financial health and asset values. High-resolution asset location data enhances credit risk assessment by illuminating factors that could impair a counterparty’s operations or collateral. In banking, lenders typically assess a client’s ability to repay under various conditions; knowing where the client’s revenue-generating assets are, and what risks those locations face, improves this assessment.
If a company’s key facility is knocked offline by an earthquake, flood, or political turmoil, its revenues and ability to service debt may plummet. Traditional credit analysis might capture this partially through business continuity planning or insurance coverages, but without geospatial analysis it may not be clear that, say, 60% of a company’s production capacity is concentrated along a single hurricane-exposed coastline. By mapping a borrower’s assets, banks can evaluate how geographically diversified the operations are and whether they have any critical clusters of exposure. A diversified manufacturing firm with 20 plants around the world is a very different credit risk if, upon mapping, one discovers that half those plants are located in one river valley floodplain. Such a concentration could spell disaster in the next severe flood. In fact, studies of corporate defaults have found that natural disasters and supply shocks can precipitate financial distress for companies lacking geographic diversification. Granular location data allows credit models to incorporate location-specific risk factors (e.g. probability of extreme weather at the asset’s site, local infrastructure reliability, etc.) as inputs to scenario analysis on debt service coverage and cash flows.
Collateral and asset valuation: Banks and investors often have collateral or directly hold assets (project finance, real estate, etc.) whose value is sensitive to location. A commercial real estate lender, for example, must consider flood zones or coastal erosion for the properties securing its mortgages. With precise coordinates, a lender can automatically check each property against hazard zones (using GIS tools) and adjust loan-to-value ratios or interest rates to account for higher risk. In credit portfolios, loan concentration in certain regions can be monitored via mapping. If too much exposure accumulates in one high-risk area, the bank can set limits or require additional guarantees. Regulators encourage this: supervisors now expect banks to assess “concentration risk” in climate-sensitive regions as part of their credit risk management. Asset location intelligence makes such monitoring feasible in real time, rather than waiting for borrowers to report problems.
Additionally, the cost of capital in the market is likely to start reflecting these granular risks. Just as insurers charge higher premiums for properties in flood zones, lenders and bond investors may demand higher spreads for companies whose asset maps reveal vulnerability. There is evidence this is beginning: companies with heavy exposure to environmental risk are starting to face tougher financing conditions. Industry experts predict that firms managing climate and biodiversity poorly (as evidenced by many high-risk sites) will face higher insurance premiums or borrowing costs due to perceived unmitigated risks. Credit rating agencies have also taken note, with asset-level risk analysis becoming part of credit rating methodologies. This underscores how precise asset location data is becoming integral to evaluating creditworthiness, enabling a shift from generic, sector-level credit risk estimates to a more fine-tuned view that differentiates two borrowers in the same industry by the resilience and riskiness of their operating locations.
Operational and supply chain risk
Recent history has provided lessons in how location risk translates to operational disruption. In our globalised economy, a shock in one location can ripple through supply chains worldwide. High-resolution data on where a company’s own facilities and its key suppliers are located is vital for mapping these vulnerabilities and building more resilient operations.
Geospatial risk analysis for supply chains involves mapping not only a company’s own plants and warehouses, but also the locations of critical suppliers, transportation nodes (ports, rail hubs), and even key markets. By overlaying these with hazard data, firms can identify single points of failure. For example, if a company finds that all its semiconductor suppliers are clustered in one high seismic risk zone, it has a clear operational risk that can be mitigated (by qualifying a supplier in a different region, increasing inventory, or purchasing contingent business interruption insurance). Likewise, knowing facility locations helps in business continuity planning: companies can pre-emptively plan how to shift production if one site goes down, but that requires knowing which sites are at greatest risk.
Financial institutions, even if not directly managing factories, have a stake in this through the companies they finance. A bank’s corporate loan portfolio could be heavily exposed to a supply chain shock if many borrowers rely on the same vulnerable supplier or logistics hub. By using asset location data, banks and investors can perform supply chain stress tests. For instance, they might simulate a scenario where a major port is closed by a storm for a month, and then identify which portfolio companies have facilities that normally ship through that port. This kind of analysis turns generic operational risk into a concrete map of potential bottlenecks. It also informs engagement with companies: investors can encourage firms to address gaps in their location data and improve supply chain transparency as part of risk management. Here too, regulators are stepping in – emerging guidelines on operational resilience (including those related to climate risk) advise firms to understand location concentrations in their supply chains. High-resolution location data is the foundation for meeting those expectations.
Geopolitical and Strategic Risk
Geopolitical events – wars, civil unrest, sanctions, trade disputes – have starkly illustrated how asset location can become a financial liability or loss virtually overnight. The value of overseas assets and operations can swing dramatically based on political decisions or conflicts; mapping where those exposures lie is crucial for strategic risk management.
Changes in trade policy (tariffs on goods from certain countries), expropriation or nationalization of assets by governments, social unrest that shuts down facilities, or even regional shifts in taxation can be part of this analysis. By cataloguing assets by country, region, and even local province, financial analysts can quantify exposure to these risks. Furthermore, precise location data supports compliance with sanctions and trade controls.
Supporting scenario modelling, stress testing, and regulatory alignment
The increasing granularity of risk data is not happening in a vacuum – it aligns with broader trends in financial regulation and risk management frameworks. High-resolution asset location data directly supports scenario modelling and stress testing exercises that are now commonplace for climate risk, and it helps institutions meet new regulatory requirements on risk disclosures and analysis.
TCFD recommends that organizations conduct scenario analysis to assess how they might perform under different climate futures (e.g. warming of 2°C or 4°C, orderly vs. disorderly transition). To make these scenarios meaningful, companies and banks need to connect scenario variables (like physical hazard changes or carbon price trajectories) to their specific exposures. This is most effective when done bottom-up: asset by asset. For physical risk, this means taking location-specific climate projections (such as how flood frequency will increase in a given river basin, or how cyclone intensity might change in a coastal area) and applying them to the assets in those locations.
Without precise coordinates, firms might resort to using country-level or region-level averages that dilute extremes. With coordinates, they can directly query: Asset A lies in a zone where flood risk is projected to increase 3x by 2050 under Scenario X – what does that imply for downtime or damage? Summing up those impacts across all assets yields a far more credible picture of portfolio risk under that scenario. Indeed, global climate scenarios produced by the NGFS come with geographically resolved data (for example, maps of extreme heat days or agricultural yield changes by region). Financial institutions armed with geospatial asset data are able to leverage these rich datasets fully, effectively “painting” their portfolio onto the NGFS maps to see outcomes. This was evidenced in early climate risk scenario exercises: banks with better granular data could calculate expected loss changes with more confidence, while others had to acknowledge larger uncertainties due to data gaps.
Regulators are increasingly conducting climate and environmental stress tests for banks and insurers. The ECB’s 2022 climate stress test, for instance, not only examined how bank portfolios would handle transition shocks (like a sudden carbon price), but also how physical disasters in specific regions would affect credit risk. However, the ECB noted significant data gaps – many banks did not have the exact locations of corporate collateral or operations, forcing the exercise to use simplifying assumptions. This has led to guidance that banks should improve data collection on asset locations to refine future stress tests. Similarly, the Bank of England’s Prudential Regulation Authority and the U.S. Federal Reserve have launched climate scenario pilots that effectively require banks to have detailed knowledge of their exposures (e.g., how many mortgages are in Florida vs. other states for a hurricane scenario). High-resolution asset data enables firms to meet these regulatory demands by providing a clear, auditable mapping from their portfolios to the risk factors in scenarios. It also supports risk aggregation in line with regulatory reporting – for example, being able to report “our total exposure to high-risk regions is £X, broken down by flooding £Y, wildfire £Z, etc.” as supervisors often request.
Beyond climate, consider nature-related risk frameworks. The Taskforce on Nature-related Financial Disclosures in 2023 introduced disclosure recommendations that include identifying “priority locations” of operations that have significant biodiversity risk. The EU’s Corporate Sustainability Reporting Directive (CSRD) likewise will require companies to report the number of sites in or near biodiversity-sensitive areas. These are very explicit location-based disclosure mandates, pushing firms to move from broad sustainability statements to concrete geospatial reporting. They mirror the direction climate risk regulation is headed: more location-explicit information in disclosures. In fact, under CSRD’s climate reporting (ESRS E1) and the new ISSB climate standard, companies must disclose material physical risks and concentrations of these risks – effectively asking, “do you have significant assets exposed in particular locations that could create concentrated climate risk?” Addressing such questions is only feasible with validated asset-level data.
One might wonder if all this asset-level detail complicates the big picture. On the contrary, it enhances the big picture by allowing flexible aggregation and slicing of risk data. With each asset tagged by location (and ideally linked to a specific company or obligor), a financial institution can aggregate risk in multiple ways: by company (to see that company’s overall risk), by sector, by geography, by supply chain cluster, etc. This is essential for identifying concentrations and correlations. For instance, an investor can aggregate all asset risks by river basin to see if many portfolio companies share exposure to the same water-stressed watershed – a systemic risk that would not be visible if one only looked company by company. Aggregating by country can reveal if a portfolio is overexposed to, say, a single market. In regulatory stress tests, results are often reported at portfolio or sector level; however, bottom-up risk aggregation can yield a more accurate and granular understanding of portfolio risk given the ability to preserve the heterogeneity of underlying exposures. It also helps avoid double counting or omission: each asset is a data point that can be assigned to one and only one bucket in an aggregation, ensuring completeness and consistency in risk totals.
Lastly, by adopting high-resolution geospatial analysis, financial institutions are aligning themselves with the direction of travel in regulation, more clearly mapping their internal risk assessments to frameworks like TCFD, NGFS, CSRD, and TNFD. Maps and metrics derived from precise asset data aim to satisfy increasingly granular and sophisticated risk management requirements. As disclosure standards become more demanding, the data foundation is already in place. In summary, high-resolution asset data is a strategic asset in itself for scenario planning and regulatory compliance: it equips organisations to anticipate adverse scenarios and quantify them rigorously.
Data quality, validation, and best practices in geospatial risk analysis
The power of high-resolution asset location data depends fundamentally on its quality and how it is used. Incorrect or incomplete location data can mislead analysis. Thus, leading institutions and data providers follow best practices to gather, validate, and maintain asset location information for risk purposes. Below, we consider multiple aspects of collating such data:
● Multiple data sources and validation: No single source perfectly captures all asset locations, so a multi-pronged approach is best. Companies may disclose some facility locations in reports (especially large mines, factories, or power plants), and there are public registries for certain sectors (like national databases of industrial facilities, plants with emissions permits, etc.). These provide a starting point but often have gaps (e.g. private companies or smaller sites may not be listed). Geospatial researchers and NGOs have contributed by using satellite imagery and remote sensing to identify assets such as mining sites, deforestation fronts, or temporary facilities. Satellite data offers very high spatial accuracy and can even catch assets that are hidden or unreported, but interpreting imagery requires expertise and it may be hard to link what’s seen from space to a specific company without additional context. Another growing source is AI and web-scraping – algorithms comb through news, websites, and documents to find mentions of facilities and their locations. This can uncover the “long tail” of assets (for instance, a small factory mentioned in a local news article) and is language-agnostic, but can be noisy and requires verification.
Best practice points to cross-verification of locations from multiple sources. If an address is found in a corporate report and also detected via satellite and appears in a news source, one can be more confident of validity. NatureAlpha takes this approach implementing rigorous validation, including the use of AI/machine learning to reconcile discrepancies and continuously update data. Public data is integrated where available, AI is used to validate and detect changes, and geospatial analytics (like checking if a stated location lies within known industrial zones or near expected infrastructure) is used to flag inconsistencies. Human expert review is often the final step for quality assurance on critical records. The result of such integration is a comprehensive, up-to-date asset registry that is suitable for financial analysis, delivered in a standardized format and linked to company identifiers (like ISINs). Indeed, the CGFI’s recommendations call for moving toward standardised, open asset-level data to improve usability in finance.
● Ongoing updates and change detection: Corporate assets are not static – companies open new sites, close old ones, and acquire or divest facilities through M&A. To remain useful, an asset location dataset must be continuously maintained. Leading datasets are refreshed quarterly or even in near-real-time for certain critical changes. They employ change-detection algorithms to spot new construction (via satellite) or new entries in permit databases may highlight when an asset’s ownership might have changed (e.g., a factory sold from one company to another). This ensures risk models keep pace with the evolving real world.
For example, if a portfolio company builds a new plant in a coastal area, the dataset updates this information, and the portfolio’s flood risk can be adjusted accordingly rather than remaining unaware of the new exposure. Likewise, if a risky asset is closed, data updates should reflect its removal, avoiding overestimation of risk. Some providers also offer alerts and change feeds – for instance, alerting a bank if one of its borrowers just had a significant expansion into a high-risk region. Banks can integrate these feeds into their risk dashboards to work with the latest information.
● Materiality filtering and context integration: Having millions of data points is valuable, but to extract insight one must separate material sites from immaterial ones. Best practices in geospatial risk analysis therefore involve filtering and weighting assets by their significance. Criteria for materiality might include the asset’s size, production capacity, contribution to revenue, or unique role (e.g., sole supplier vs. one of many). This prevents “analysis paralysis” or dilution of risk signals by trivial facilities. In NatureAlpha’s approach, for example, algorithms distinguish core operational sites from ancillary ones to maximise signal-to-noise ratio. An analyst using the dataset can then focus attention on the subset of assets that drive the bulk of risk. Importantly, this filtering can be tuned to the use case – a nature and biodiversity risk analysis might filter out small urban offices, whereas a pandemic disease risk analysis might actually want to consider offices if disease hotspots are of importance.
Enriching asset data with contextual layers then becomes a source of rich information. Where an asset coordinate alone is a point on a map, it becomes more informative when context is attached - for example highlighting locations within X kilometres of a protected forest, or in a zone with Y meters of projected sea-level rise by 2050. This is typically done by intersecting asset locations with various geospatial layers – climate hazard models, land use maps, socio-political risk maps, etc. The result can be provided as metrics or flags. NatureAlpha’s system, for instance, evaluates each project location against 28+ environmental layers to produce a suite of risk indicators.
● Awareness of limitations: Ensuring data quality means engaging with data gaps and uncertainties transparently. No dataset is perfect, and part of best practice is documenting where data is sparse or less certain, whilst continually refining processes and data gathering - all of which is supported by greater automation and quantitative, repeatable approaches. For example, there might be regions (like conflict zones) where verifying asset data is harder, or sectors (like small agriculture or private firms) where coverage is lower; equally data gathering approaches and cross-validation can act like a microscope in areas where coverage was previously sparse. Some countries, by design my discovery of company data difficult to discover – China, Russia and North Korea are just a few notable examples, where precise, robust data is obfuscated or hidden by governments.
A robust geospatial risk approach can flag these confidence issues. It will also continually seek to improve coverage – for instance, using AI to discover previously unrecorded assets. In summary, the value of high-resolution asset location data comes not just from the data itself but from methodologically sound practices in assembling and using it. By combining diverse data sources, rigorously validating and updating records, filtering for materiality, and layering on rich context, financial institutions can trust that their geospatial risk insights are built on rock-solid foundations. This in turn empowers risk teams to confidently integrate these insights into decision-making.
Conclusion
In an era of compounding and interconnected risks, asset location precision has moved from a niche concern to a foundational element of financial risk analysis. High-resolution geospatial data transforms how banks, investors, and insurers understand their exposure – offering a lens to see risks that were previously hidden in aggregate numbers. It enables a shift from reacting to surprises (a flood here, a factory fire there, a conflict elsewhere) to proactively mapping vulnerabilities and preparing for them. By embedding location intelligence, financial institutions gain the ability to perform sophisticated scenario modelling (climate, geopolitical or otherwise), to stress test portfolios under spatially explicit shocks, and to aggregate risks in ways that highlight concentrations and diversification opportunities. This not only improves risk management and capital allocation decisions, but also ensures organizations stay ahead of regulatory curves on disclosure and stress testing.
Importantly, the benefits of granular location data are multi-dimensional – enhancing climate physical risk assessments, informing transition risk strategy, sharpening credit risk models, safeguarding operations and supply chains, and flagging geopolitical dangers. It addresses critical gaps left by traditional data: bridging the disconnect between firm-level reporting and site-level reality. As we have seen, a company might appear safe on paper but have a handful of assets in precarious locations that drive outsized risk; conversely, geospatial analysis can also dispel false alarms by putting risks in proper context. In the language of risk management, it greatly improves the signal-to-noise ratio, allowing decision-makers to focus on what matters most.
The adoption of asset-level geospatial data aligns tightly with emerging frameworks and industry best practices. It operationalizes the guidance of initiatives like TCFD, which call for assessing and disclosing location-specific climate impacts, and it answers the call of supervisors who have been “flying blind” with coarse data and are now pushing for better risk information. It also complements efforts like TNFD for nature-related risk and broader ESG integration – essentially providing the underlying data needed to make any environmental or social risk analysis more concrete and science-based. As one report aptly put it, “having the coordinates of risk” is becoming essential for aligning finance with real-world conditions. This geospatial grounding of finance is likely to grow in importance as the world’s climate and geopolitical landscape continues to change.
In conclusion, high-resolution asset location data represents a powerful innovation at the nexus of finance, technology, and science. It is more than a technical nicety; it is a strategic imperative for risk-aware financial institutions. Those that invest in building and leveraging this data may welll be better equipped to navigate the uncertainties of our global markets – not only avoiding pitfalls but potentially finding new opportunities (for example, financing climate adaptation projects or nature-based solutions where they are needed most). By integrating granular location intelligence into risk frameworks, institutions can drive more resilient allocation of capital throughout a period where growth is key.
Appendix: Nature in focus
High-resolution asset geolocation data is emerging as a cornerstone for assessing nature and biodiversity-related risks in finance. Unlike traditional ESG datasets that aggregate impacts at the company level, spatially precise asset data enables investors and regulators to pinpoint where business activities intersect with nature and where businesses could face risks previously hidden - whether through their direct operations or supply chains.
Regulators and frameworks worldwide are pressing financial institutions to assess and disclose nature-related risks with unprecedented rigor. A unifying theme across these initiatives is location: where a company’s assets and operations physically intersect with ecosystems is fundamental to understanding nature and biodiversity impacts and dependencies, and subsequent natural world risk.
Recent frameworks underscore this point:
● TNFD (Taskforce on Nature-related Financial Disclosures): In its final recommendations (2023), TNFD added a disclosure requirement for “priority locations.” Companies are advised to “Disclose the locations of assets and/or activities in the organization’s direct operations and, where possible, its upstream and downstream value chain(s) that meet the criteria for priority locations.”. The TNFD’s recommended LEAP approach (Locate-Evaluate-Assess-Prepare) explicitly starts with mapping a company’s interface with nature by identifying where assets and supply chains are situated relative to ecosystems.
● SFDR (EU Sustainable Finance Disclosure Regulation): Under SFDR’s Principal Adverse Impact (PAI) indicators, Indicator #7 tracks “activities negatively affecting biodiversity-sensitive areas.” This is defined as the “share of investments in investee companies with sites/operations located in or near biodiversity-sensitive areas”. Biodiversity-sensitive areas include legally protected zones (the EU’s Natura 2000 network, UNESCO World Heritage Sites) as well as Key Biodiversity Areas (KBAs). Compliance with SFDR PAI#7 inherently demands high-quality data on where investee companies’ assets are located relative to those sensitive areas.
● CSRD (EU Corporate Sustainability Reporting Directive) – ESRS E4 (Biodiversity & Ecosystems): The new European reporting standards require companies to disclose the number and area of their sites “in or near biodiversity-sensitive areas”. Even if biodiversity is deemed non-material to a company, CSRD mandates at least an assessment of whether any operations are near protected or sensitive habitats. This pushes companies toward granular mapping of operational sites and their proximity to protected areas, to fulfill disclosure obligations.
● Kunming-Montreal Global Biodiversity Framework (GBF) – Target 15: Agreed at COP15 in 2022, Target 15 calls for all large companies and financial institutions to “regularly monitor, assess, and transparently disclose their risks, dependencies and impacts on biodiversity… across their operations, supply and value chains, and portfolios”. In practice, this means identifying where portfolios interact with nature – from mines in tropical rainforests to farms near wetlands – to reduce negative impacts and nature-related risks by 2030.
These frameworks converge on a simple truth: nature-related risk is location-specific (Report: Location, Location, Location: Asset Location Data Sources for Nature-Related Financial Risk Analysis - UK Centre for Greening Finance and Investment (CGFI)). The impact of a factory on biodiversity depends on where it is – a plant built atop a wetland will have vastly different risks than one in an industrial park. As the UK Centre for Greening Finance & Investment (CGFI) noted, “Companies’ dependencies and impacts on nature are inherently location and context specific. Location data of counterparties’ operations is therefore critical for financial institutions to understand nature-related financial risks in a meaningful way.” (Report: Location, Location, Location: Asset Location Data Sources for Nature-Related Financial Risk Analysis - UK Centre for Greening Finance and Investment (CGFI)) In short, without asset-level location intelligence, financial risk analyses will miss the forest for the trees – literally and figuratively.
I Spatial risk identification vs. conventional ESG data analysis
● Limitations of traditional ESG data: Conventional ESG ratings and data often operate at the corporate or regional level, diluting local environmental nuances. For example, a company’s nature or biodiversity assessment might be based on firm-wide policies or aggregate land footprint, but this fails to distinguish a mine in a biodiversity hotspot from one in a desert. Studies have highlighted that “the inadequate consideration of biodiversity in ESG assessments” is a persistent gap, underscoring the need for more relevant biodiversity indicators. Traditional ESG datasets also suffer from inconsistencies – different providers use divergent data sources and criteria, leading to the well-documented “ESG ratings divergence” problem.
● The scientific case for geospatial sustainability data: Recent research points to geospatial data as a key to improving ESG and risk analysis. Rossi et al. (2023) argue that incorporating high-resolution spatial information offers “several key advantages for ESG assessments, including consistency, the potential for enhanced accuracy, and the ability to identify and assess environmental impacts at a detailed physical asset level, in addition to evaluating the broader spatial context.” In other words, by knowing exactly where operations occur, analysts can marry asset-level impacts with local environmental conditions – e.g., local biodiversity intactness, nearby protected areas, water stress levels, and more – yielding an asset-specific risk profile. This granular approach contrasts with generic, company-average metrics that often miss site-level hotspots of risk.
● Spatial context reveals hidden risks: Double materiality looks at both how nature can impact a company and how the company impacts nature. Many dependencies (like pollination or water purification) and impacts (like deforestation or water pollution) are invisible in aggregated data but visible when mapped. For instance, an agribusiness might seem low-risk until geospatial analysis shows its plantations overlap with endangered species’ habitat and water-scarce basins. Metals and mining firms in particular have a high share of assets in such areas, often without robust measures to manage those risks. This kind of insight – pinpointing which assets are in sensitive ecosystems – is rarely attainable through conventional ESG scores or voluntary corporate reporting.
II Approaching asset location intelligence
NatureAlpha addresses the above challenges by combining advanced technology with ecological expertise to build a robust asset location dataset tailored for nature and biodiversity risk analysis:
● Comprehensive asset coverage: NatureAlpha’s database covers over 8.5 million physical business assets globally, across industries, with over 1 million assets linked to listed securities (via ISINs) and an additional 7.5 million assets mapped as sector reference points (e.g., mines, factories, power plants, warehouses). This breadth ensures that not only the obvious large facilities are captured, but also reference assets for high-impact sectors; for example, mines from several companies are often concentrated in similar areas, and are likely to exacerbate nature impacts and dependencies of all mines in a given area. Understanding what other operational assets are located around a given asset can help to add additional granularity to analyses.
● High-frequency updates: The dataset is refreshed quarterly, with continuous addition of new assets and retirement of closed ones. It aims to track operational changes such as new site openings, acquisitions, and closures. This dynamic aspect is key – nature risk is not static, and corporate asset footprints change with M&A activity, expansions, and divestments. Quarterly change feeds and alerts (e.g., if a company acquires a mine in a rainforest) allow stakeholders to react promptly. Traditional asset databases can quickly become outdated, undermining risk assessments if, say, a risky site was sold off last year or a new project just broke ground. NatureAlpha’s process aims to ensure a living dataset that mirrors the real world.
● Two-dimensional discovery framework: NatureAlpha employs what it describes as a two-axis approach. The first axis is horizontal – scanning entire industries globally to map all relevant assets (public or private). The second axis is vertical – drilling down into a specific company’s unique “DNA” of operations. For example, horizontally, NatureAlpha might compile a global inventory of all oil refineries or all commercial farms above a certain size (sector-wide coverage). Vertically, it then ensures that for a given company (e.g., Shell), it captures assets particular to Shell’s value chain (like its joint ventures, subsidiaries’ operations, etc.). The intersection yields a full picture of a company’s assets in the context of its industry’s footprint. This methodology means even if a company doesn’t disclose a facility, it might still appear by virtue of the sector-wide scan. It also places each company into a broader industry context (e.g., how does Shell’s footprint in key ecosystems compare to peers like BP or Total).
● Materiality filtering (“noise reduction”): As discussed, not every asset is relevant for nature risk. NatureAlpha’s system uses sector-specific criteria to filter out “noise” – assets unlikely to carry material environmental impact. For instance, a luxury retail boutique or a small urban bank branch may be logged in the dataset (for completeness), but the platform can flag it as low-impact (thus de-prioritized in risk analyses). Conversely, assets with large physical or ecological footprints (mines, plantations, large factories, dams, etc.) are tagged as high-impact. This intelligent filtering is informed by “industry expertise and cutting-edge AI” to ensure risk models focus on what truly matters. The outcome is an accurate, actionable set of asset locations for each company, aligning with the notion of “priority locations” in TNFD terms (sites that are material and/or sensitive for nature risk).
● Validation via AI and LLMs: A critical pillar of NatureAlpha’s approach is data validation using artificial intelligence. Traditional data verification (calling facilities, checking reports) is laborious and often lags behind reality. Instead, NatureAlpha leverages the latest large language models (LLMs) to automate the discovery and verification of asset information. These AI systems scour unstructured data – news articles, reports, websites, satellite imagery metadata – to confirm if a given asset is active, to fetch its latest status or ownership, and to catch discrepancies (e.g., a plant reported as closed in a recent press release). By “assessing whether facilities remain active, and identifying discrepancies”, the AI validators keep the dataset current without extensive manual checks. This approach marries scale with accuracy: millions of data points can be cross-checked rapidly. Moreover, LLMs can parse local languages and obscure sources (like regional environmental permits or community reports) that a standard data process might miss. The result is a self-updating, self-correcting asset register. Importantly, this validation maintains “scientific rigor” – erroneous or outdated data is removed, ensuring decision-grade accuracy.
● Ecological and risk overlay: Finally, NatureAlpha doesn’t stop at mapping locations – it contextualizes them with environmental data layers. Each asset comes with a rich metadata of risk indicators: proximity to protected areas (e.g., distance to the nearest National Park or Ramsar wetland), overlap with Key Biodiversity Areas, local species richness and endemism, ecosystem integrity indices, water risk levels, deforestation alerts, and more. This allows users to quantify risk at asset-level and aggregate up to company or portfolio-level spatial risk exposure. NatureAlpha’s proprietary Nature Risk exposure metric combines several factors to rate an asset or company’s overall nature-related risk exposure. By having the underlying components, users can drill down (e.g., a high risk score might be driven by a refinery’s proximity to a coral reef and high water stress exposure). This multi-metric approach aligns with global conservation science (using data from IBAT, IUCN, WRI Aqueduct, etc.) and policy frameworks. For example, NatureAlpha’s risk scoring is mapped to the drivers of biodiversity loss as identified by IPBES (land use change, pollution, etc.) and is aligned with frameworks such as TNFD’s LEAP, IFC Performance Standard 6, SFDR PAI#7, and GBF Target 15.
In summary, NatureAlpha’s asset location intelligence offers a scientifically grounded, scalable, and up-to-date foundation for nature risk analysis. It strives to solve the twin problems identified by data experts: that “location data is more widely available than perceived” but often underutilized, and that existing datasets have “usability limitations” like inconsistent formats or poor coverage. By standardizing and augmenting multiple sources through AI, NatureAlpha effectively provides a one-stop data solution. The benefits of this approach become clearer when contrasted with other asset data sources and methodologies.
III Asset data sources and discovery methodologies - compare & contrast
Traditionally, analysts have relied on a patchwork of sources to piece together where companies operate. Below, we compare discovery methods, highlighting pros and cons of each:
Comparison Summary: Table 1 below provides a high-level comparison of these approaches in terms of coverage, accuracy, update frequency, and suitability for nature and biodiversity risk use-cases.

NatureAlpha’s approach aims to integrate the strengths of these approaches while mitigating many drawbacks. It leverages public data and disclosures where available (ensuring accuracy and detail), uses AI to uncover gaps and keep data fresh, employs geospatial analytics akin to NGO efforts to tag environmental context, and delivers data in a consistent, standardized format suitable for financial analysis. The result is a dataset that the CGFI report’s recommendations seem to anticipate: asset-level disclosure, open data access, and standardized methodologies to improve usability of location data.
IV Use Cases: Regulators, Investors, Stewards
A high-resolution asset location dataset unlocks a range of applications across the financial sector ecosystem:
● Regulatory Supervision & Risk Analysis: Central banks and financial regulators are increasingly concerned about nature-related systemic risk. For example, the Network for Greening the Financial System (NGFS) and the Financial Stability Board (FSB) have highlighted the need to assess how biodiversity loss could affect financial stability. To conduct stress tests or scenario analyses, regulators need to know where banks’ and insurers’ exposures lie relative to biodiversity hotspots or vulnerable ecosystems. NatureAlpha’s data can feed into such models by mapping loan books or investment portfolios to specific locations. Supervisors could identify, say, that a large share of a country’s banking assets (through project finance or corporate loans) are tied to operations in Amazonia or Southeast Asian peatlands – indicating concentration risk if deforestation or climate impacts in those areas accelerate. Moreover, as EU regulators implement the CSRD, they will expect companies to report “sites near biodiversity-sensitive areas”; NatureAlpha could serve as an independent check or data source to verify those disclosures across thousands of companies.
● Asset Managers & Institutional Investors: Portfolio managers can use location intelligence to enhance risk management and compliance. Data can be integratetd with existing risk management screens and applied to optimise portfolios. Under SFDR, an asset manager must report the percentage of its funds’ investments in companies with operations in biodiversity-sensitive areas (PAI #7). With NatureAlpha data, an asset manager can proactively measure and manage this exposure. For instance, it is possible to screen portfolio holdings against a global map of protected areas and KBAs (as embedded in NatureAlpha’s risk metrics) and flag holdings with high exposure. Engagement strategies can then be formulated for those companies (ask them about mitigation plans for those sites, or adjust portfolio weight if risk is too high). Similarly, investors are keen to identify “stranded asset” risk related not just to climate, but nature – e.g., will a new mining project face permit denials or community backlash due to its location? By having granular data, an investor can anticipate such issues. On the opportunity side, investors can also seek out companies with positive overlaps, such as operations near degraded areas that present nature-based solution opportunities (reforestation, restoration potential, etc.). In essence, spatial data enables nature-aware portfolio allocation, avoiding unpriced risks and aligning investments with biodiversity goals.
● Banks and Lending Decisions: Banks conducting environmental and social due diligence for project finance or corporate loans can integrate NatureAlpha’s asset dataset into their ESG risk assessment workflows. For a given loan applicant, the bank can instantly retrieve all known asset locations for that company (and even its supply chain, if mapped) to check for red flags: Are any sites in protected areas? Is the company operating in water-stressed basins or regions prone to ecosystem decline? This is far more efficient than relying on the client to self-report or hiring consultants to map sites from scratch. As a concrete example, DNV – a technical due diligence firm – partnered with NatureAlpha to embed such analytics in their process. They screen energy project locations for overlaps with protected areas, KBAs, wetlands, etc., using NatureAlpha’s NatureSense engine. This provides instant nature and biodiversity red flags at project inception, delivered through maps and dashboards. For banks, this kind of tool can significantly improve the credit risk appraisal: deals that might carry hidden biodiversity liabilities can be identified early (for instance, a loan for a plantation that, unbeknownst to the bank, is adjacent to an area of high species richness and community importance – signaling potential for conflict or legal issues).
● Stewardship and Engagement: Asset owners and stewardship teams (who engage with companies on ESG issues) can use location data to drive more focused conversations. Instead of generic questions about biodiversity policy, they can pinpoint: “We notice you have X number of facilities within 5 km of protected areas or indigenous lands – what is your strategy to manage and mitigate impacts at those sites?” This level of detail changes the game: companies realize that investors can see where their risks are, increasing accountability. It also helps track improvements – if a company relocates an operation or implements stronger site-level mitigation (like creating buffer zones or funding local conservation), the data can reflect that, and investors can give credit for it. Furthermore, in collaborative engagements or initiatives like Climate Action 100+ (which may expand to nature), having a shared, credible dataset of company asset locations in sensitive areas can align stakeholder understanding of the problem. Stewardship becomes more concrete – centered on specific geographies and assets rather than lofty promises.
● Insurance and Underwriting: Insurers can benefit by assessing physical and liability risks of insured assets. For example, an insurer writing property insurance for a factory might price risk not only on climate factors but also nature factors (is the site likely to face new conservation regulations? Could biodiversity loss in the area lead to ecosystem service degradation that affects operations?). Liability insurers may evaluate if a company has sites in areas where biodiversity lawsuits or fines are a risk (for instance, operating next to a declining coral reef could invite future litigation or government action). With NatureAlpha’s data, underwriters can systematically include such considerations.
● Corporate Strategy and Reporting: Lastly, companies themselves can use the data as a gap analysis tool. A corporation preparing for CSRD or TNFD might license NatureAlpha’s dataset to double-check its own internal site list and ensure no site is overlooked in sensitive areas. It can also benchmark itself against peers: for example, a consumer goods company might evaluate how many of its factories overlap with biodiversity hotspots versus its competitors, informing strategic decisions (perhaps deciding to prioritize certain sites for investment in biodiversity mitigation to stay ahead of peers). In terms of opportunity, companies can identify where they might contribute to conservation (say, sites near high biodiversity areas could be candidates for corporate nature reserves or community projects, turning a risk into a positive impact story).
In each of these use cases, better data aims to lead to better decisions and disclosures. With spatial asset intelligence, organizations move from an averages-based understanding of nature risk to a vivid, map-based understanding. This is crucial for materiality assessments also. Under double materiality (as per CSRD), companies must consider how nature impacts them (financially material) and how they impact nature (environmentally material). Both sides of that coin require location-specific insight: financial impact (e.g., physical risk to operations from ecosystem collapse, which depends on location and local ecosystem health) and impact on nature (e.g., how an operation degrades local biodiversity). NatureAlpha’s data supports both, allowing analysis of dependencies (which ecosystem services each site relies on, like water flow regulation or pollination) and impacts (what the site contributes to, like habitat loss or pollution).
V AI and Continuous Improvement
One of the most innovative aspects of NatureAlpha’s offering is the use of Artificial Intelligence and machine learning to maintain and grow the dataset. As mentioned earlier, LLMs are employed for validation – but the AI toolkit likely extends further, including natural language processing, image recognition, and predictive modeling. This confers several advantages:
● Scalability: With over 8.5 million assets and counting, manual monitoring of each is impossible. AI “agents” can be assigned to watch different data streams. For example, a machine learning model could periodically query satellite imagery for signs of new construction at known facilities (indicating expansion) or detect if an area that used to be forest (around a plantation asset) is being cleared. Another NLP model might read local news in multiple languages to catch mentions like “Company X obtained a permit for a new project in Y province”. In this way, NatureAlpha’s coverage can scale with minimal human intervention, ensuring no asset falls through the cracks as the world evolves.
● Timeliness: An LLM-based system might flag a significant change at an asset within days of it becoming public (or even visible via remote sensing). Contrast this with traditional ESG data, where updates often happen annually. Early warning on nature risks can be critical. This enables proactive engagement and risk mitigation.
● Data fusion and cleaning: AI excels at merging datasets that don’t neatly align. If one source lists a site as “Acme Corp – Site #4” and another lists “Acme Smelter – Springfield”, algorithms can infer these are the same and merge records, especially if coordinates match. They can also reconcile changes (knowing that “Acme Corp” is now a subsidiary of “Beta Corp” after an acquisition, so re-tagging the asset’s owner). The outcome is a clean, de-duplicated master dataset. NatureAlpha’s internal methods likely include such entity resolution techniques.
● Confidence scoring: Not all data is equal in reliability. A cutting-edge approach NatureAlpha could use is assigning confidence levels to each asset location and attribute. For instance, an asset confirmed via official registry and satellite photo might be 95% confidence, whereas one scraped from a single news mention might be 70%. Users could then choose thresholds for their analyses. This approach, facilitated by AI, adds transparency to the dataset’s quality. (While not explicitly described in the user docs, this is a known best practice in large data integration projects).
● Continuous learning: The more the dataset is used and cross-validated with real outcomes, the more the AI models can learn what constitutes a true risk signal versus noise. For example, if multiple clients flag that certain types of assets were false positives (not actually material to biodiversity), the system can learn to de-prioritize those in the future filtering. Conversely, if an overlooked asset type becomes important (say, a surge in lithium mining exploration sites that weren’t previously on the radar), the system can adjust to incorporate those as a category.
The reliance on AI and LLMs allows for efficiency, QC, and also accommodates expert review.. For clients, data is accessible (e.g., via API or flat files) and up-to-date without incurring the high costs of bespoke research.
VI Implications for Materiality, Decision-Making, and Disclosure
Integrating high-resolution asset location intelligence has several broad implications:
Redefining Materiality: In the past, an issue like biodiversity might have been deemed non-material for many companies simply due to a lack of visible impact on P&L statements. However, armed with concrete location-based risk analysis, both financial materiality and environmental materiality assessments can change. For financial materiality, if a company is shown to have multiple critical sites in areas facing biodiversity decline, one might reassess the company’s exposure to operational disruptions, regulatory penalties, or community opposition – all of which can indeed impact cash flows and asset values (think of a mining project stalled by environmental lawsuits). For environmental materiality (impact materiality), location data can highlight previously ignored impacts – for instance, a food & beverage company sourcing from dozens of farms, some of which are driving local deforestation. Under double materiality, the company would need to report those impacts and potentially take action, whereas previously it might claim such impacts are outside its awareness or control. In essence, what gets measured gets managed: granular data makes biodiversity impacts tangible, often elevating their importance in corporate risk registers and boardroom discussions.
Informed Decision-Making: When nature risk is quantified at asset level, decision-makers throughout the investment chain gain a powerful tool. Portfolio managers can decide to underweight or divest from companies with unmanageable biodiversity risk or conversely invest in those turning risk into opportunity (e.g. companies leading in habitat restoration around their sites). Lenders can set loan conditions – for example, requiring a borrower to implement mitigation hierarchy (avoid, minimize, restore, offset) measures at a high-risk site, as a covenant. Corporate executives can decide where to expand or not: a company might forego developing a concession in a very sensitive area once they see a comparative analysis of the biodiversity risk (potential reputational damage, permitting delays, stakeholder resistance) versus an alternative location. Capital allocation may shift as a result – potentially steering away from projects in World Heritage sites or intact forests (which aligns with emerging norms; e.g., the WWF and other NGOs strongly advocate no-go zones in such places). We may also see innovation: insurance products for biodiversity risk, sustainability-linked loans where interest rates depend on biodiversity KPIs (like reducing the number of sites in sensitive areas), etc., all of which require good data baselines.
Enhanced Disclosures and Credibility: For reporting entities, using a robust asset dataset will lead to more credible disclosures under frameworks like TNFD and CSRD. Instead of generic statements, companies can report precise metrics: “X% of our sites (covering Y% of our revenue) are located in or near biodiversity-sensitive areas, down from Z% last year due to relocation and mitigation efforts.”
Strategic Positioning and Opportunities: Early adopters of granular nature risk assessment can position themselves as leaders in the fast-growing field of nature-positive finance. This can have reputational benefits and meet the rising expectations of consumers and stakeholders who are increasingly nature-conscious. There is also a global policy push for positive impact: the GBF not only talks about reducing negative impacts but also increasing positive impacts on biodiversity. With detailed data, companies and investors can identify where they might support conservation efforts (e.g., financing protected areas near their assets, engaging in habitat restoration around operation sites, etc.). These actions can then be communicated as contributions toward global goals (such as GBF’s aim to restore ecosystems). In short, granular data helps actors move from a do-no-harm mindset to an active nature stewardship mindset, where they can track and demonstrate improvements over time at specific locations.
Risk Mitigation and Fiduciary Duty: As understanding of nature and biodiversity risk becomes more sophisticated, fiduciaries (like pension fund managers or company directors) may be expected to account for it. A precedent is climate change – once tools existed to measure carbon exposure, investors who ignored climate risk faced scrutiny. We may see a similar evolution with biodiversity. Asset location intelligence could become a standard part of fiduciary risk management – a board’s risk committee might regularly review a “heatmap” of the company’s assets on an ecosystems map, just as they review financial risk matrices. This can drive more holistic risk mitigation plans, integrating nature with climate and other ESG factors. Over time, this could influence cost of capital: companies managing biodiversity poorly (and evidenced by data showing many high-risk sites) might face higher insurance premiums or borrowing costs due to perceived unmitigated risks.
VII NatureAlpha | Asset Location Approach
NatureAlpha’s approach combines advanced technology with ecological insight to offer actionable analytics on how company operations interact with the natural world. By identifying the precise locations that are material to their impact and filtering out unnecessary noise generated by non-material locations which can lead to incorrect assessments, this intersection of geospatial intelligence, industry expertise, and cutting-edge AI creates a robust foundation for informed decision-making in an increasingly complex and interconnected world.
Overview
Understanding and mitigating the impact of corporate activities on nature demands a structured approach that integrates geographic precision with industry-specific analysis. Unlike measuring carbon emissions or climate impacts—where aggregate metrics often suffice—nature-related risks are deeply tied to where an asset is located, what the asset does and the industry in which it operates. NatureAlpha’s methodology focuses on creating a scientifically grounded and scalable framework for discovering, verifying, and assessing the materiality of asset locations, enabling investors to act responsibly and effectively.
Quality over quantity is a core principle of NatureAlpha’s approach. This focus on delivering high-quality, material locations ensures that environmental impacts are accurately quantified and actionable. This approach not only maximizes signal-to-noise but also enables alignment with biodiversity targets and effective risk mitigation.
Framework construction
The effects of business activities on ecosystems vary not only by geographic context but also by sectoral dynamics. For instance, offshore drilling by oil companies has a significantly higher potential for harm in ecologically sensitive marine areas, while coffee cultivation, often perceived as benign, can trigger extensive biodiversity loss due to deforestation and water pollution. Even within the same industry, specific sub sectors carry different levels of environmental impact. For example, Shell’s aviation fuel division will intersect with different ecological concerns compared to its deep-water drilling operations.
To address this complexity, NatureAlpha employs a two-dimensional analytical framework. The first axis conducts a horizontal analysis across entire industries, mapping all relevant assets—whether publicly listed, privately owned, or backed by private equity. The second axis focuses vertically on a company’s unique "DNA," adding an additional level of detail about its core activities, such as oil refining, mining, or textile production. For example, in the oil and gas sector, this would involve a comprehensive global inventory of oil refineries and drilling sites. The intersection of these two axes ensures that the analysis not only captures a company’s direct operations but also identifies broader patterns within the industry.

A core feature of NatureAlpha’s methodology is the ability to combine large-scale asset discovery with precise filtering to reduce irrelevant data. Using proprietary AI models, NatureAlpha identifies and geolocates assets worldwide, focusing on specific sectors such as manufacturing, mining, or agriculture. This process extends beyond publicly available corporate disclosures, incorporating assets owned by smaller entities or less transparent organizations. However, not all discovered assets are equally material. For example, the presence of a luxury brand’s retail outlet in an airport is unlikely to be relevant to nature-related risks, as the environmental burden is more directly tied to the airport’s infrastructure. By filtering out such "noise," NatureAlpha narrows its focus to assets and locations with a significant impact on ecosystems.
Validation
Validation of asset data represents another critical pillar of NatureAlpha’s approach. Traditional methods of verifying asset information are labour-intensive and prone to obsolescence, as corporate operations evolve continuously. To address this, NatureAlpha uses the latest large language models to discover and extract details and status of asset locations, assessing whether facilities remain active, and identifying discrepancies. This automated approach ensures that the data remains current and reliable, eliminating the need for extensive manual oversight while maintaining scientific rigour.
Sources
Taskforce on Nature-related Financial Disclosures (TNFD), Final Recommendations (2023)
European Commission, 2023. European Sustainability Reporting Standards: ESRS E4 – Biodiversity and Ecosystems. Brussels: European Financial Reporting Advisory Group (EFRAG). Available at: https://www.efrag.org [Accessed 24 April 2025].
Convention on Biological Diversity (CBD), 2022. Kunming-Montreal Global Biodiversity Framework – Target 15. Montreal: UN Biodiversity Conference (COP15). Available at: https://www.cbd.int/gbf/ [Accessed 24 April 2025].
UK Centre for Greening Finance and Investment (CGFI), 2024. Location, Location, Location: Asset Data for Nature-Related Risk. London: UK CGFI. Available at: https://www.cgfi.ac.uk/publications [Accessed 24 April 2025].
World Wide Fund for Nature (WWF), 2022. WWF-SIGHT: Geospatial ESG Risk Mapping for Conservation and Investment. Gland: WWF International. Available at: https://sight.wwf.org
NatureAlpha, 2024–2025. Asset Location Intelligence Methodology and Internal Case Studies. Unpublished internal documentation. London: NatureAlpha Ltd.
Task Force on Climate-related Financial Disclosures (TCFD), 2017. Final Recommendations of the Task Force on Climate-related Financial Disclosures. Basel: Financial Stability Board.
Task Force on Climate-related Financial Disclosures (TCFD), 2020. Guidance on Scenario Analysis for Non-Financial Companies. Basel: Financial Stability Board.
European Central Bank (ECB), 2022. 2022 Climate Risk Stress Test – Results and Methodology. Frankfurt am Main: ECB. Available at: https://www.ecb.europa.eu .[Accessed 24 April 2025].
Network for Greening the Financial System (NGFS), 2022–2025. NGFS Climate Scenarios for Central Banks and Supervisors. Paris: NGFS. Available at: https://www.ngfs.net [Accessed 24 April 2025].
Rossi, C., Byrne, J.G. and Christiaen, C., 2024. Breaking the ESG rating divergence: An open geospatial framework for environmental scores. Journal of Environmental Management, 349, p.119477.


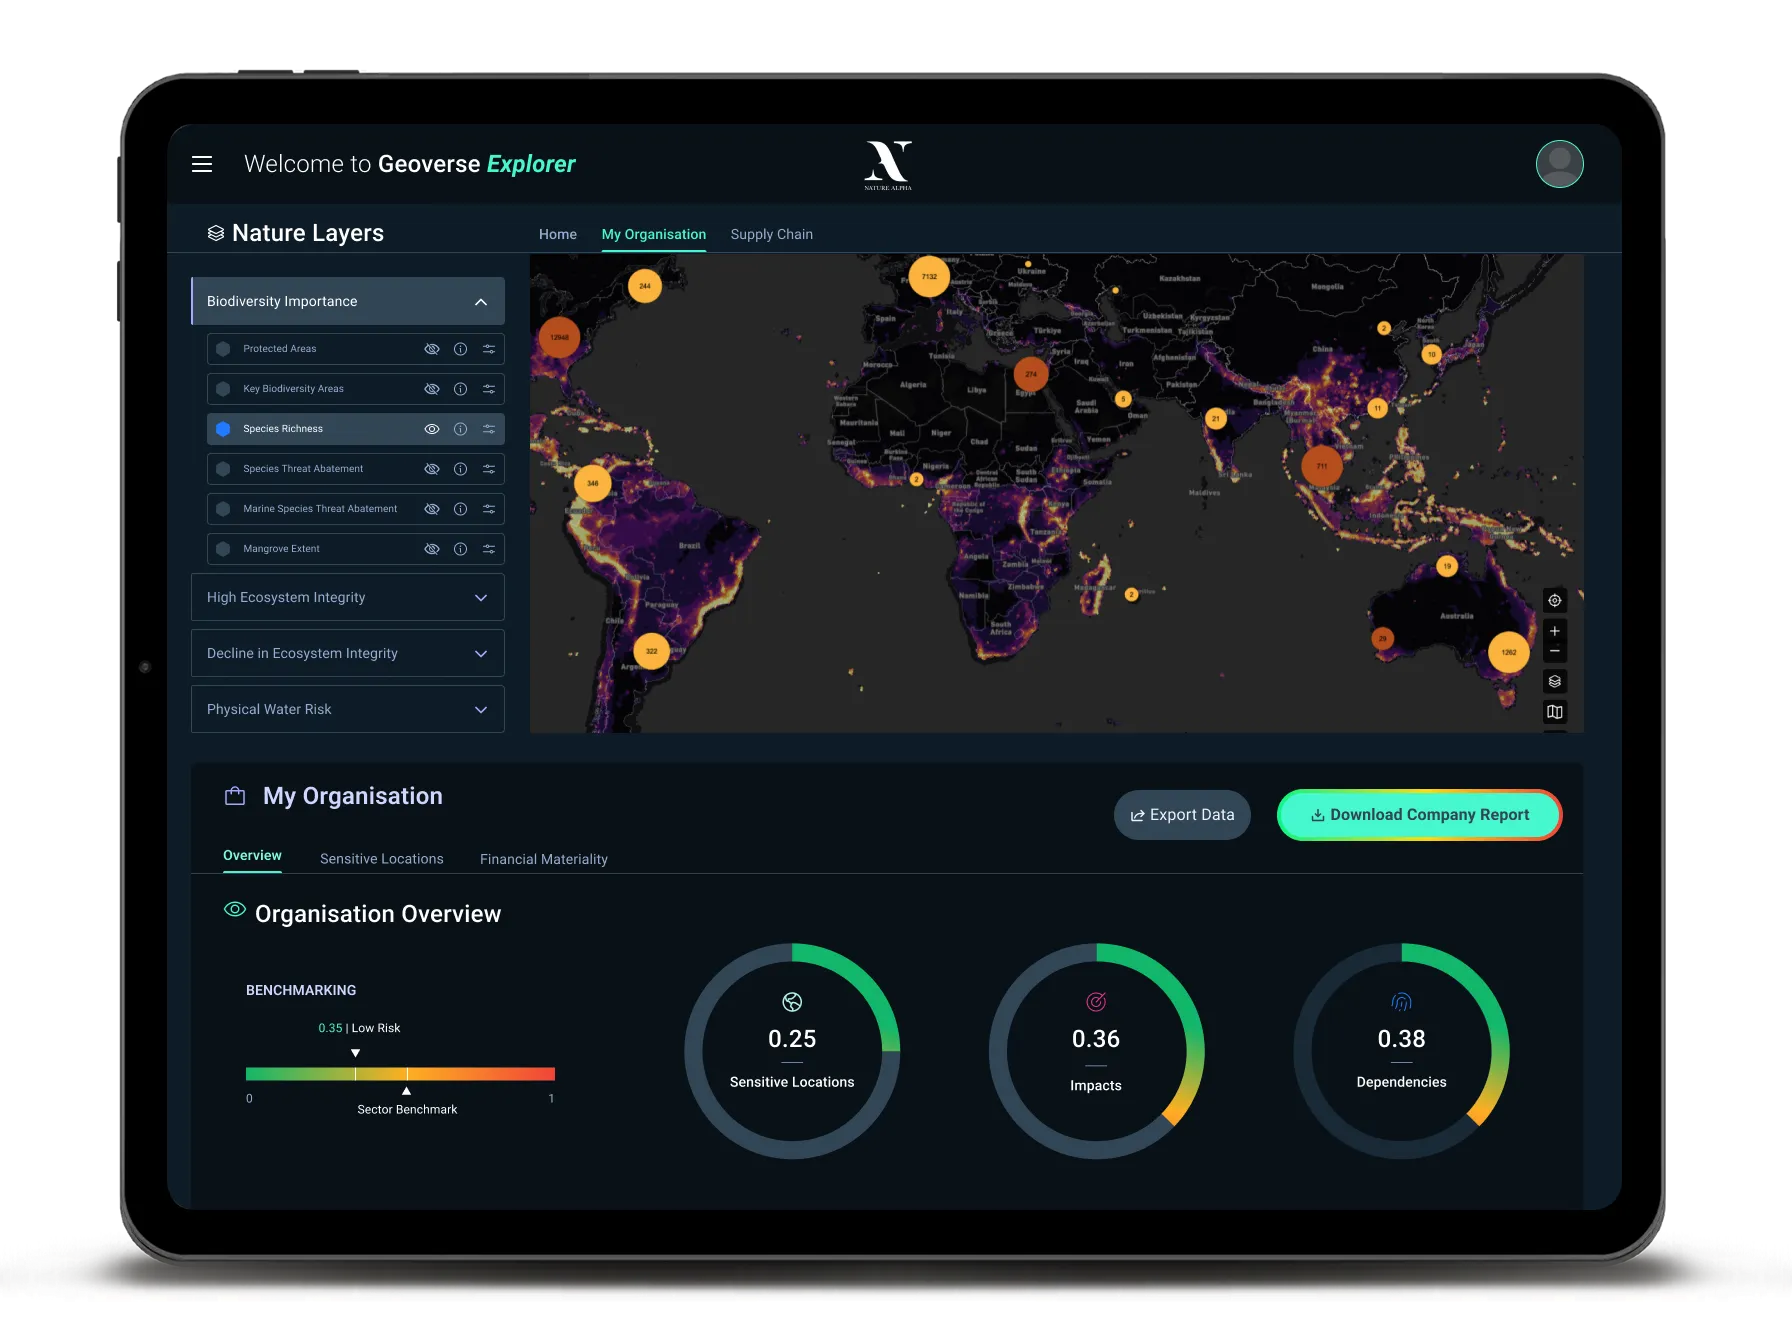

.jpg)
.jpg)
